
XAU Heatwave: Gold Weekly Review — September 7–11, 2026
This Gold Weekly Review looks back at a volatile week for XAUUSD. Gold began the week above $4,400, experienced repeated buyer and seller battles, fell sharply during Thursday's inflation reaction, and then produced a powerful Friday rebound from the weekly low.
Meanwhile, rising oil prices, stronger U.S. inflation data, higher Treasury yields, and changing Federal Reserve expectations helped shape the week's price action.
XAU Heatwave Review Hub →
XAU Heatwave combines weekly XAUUSD price action with buyer and seller behaviour, economic news, and important market levels.
XAUUSD September 7–11 Summary
Overall, gold finished the week below where it began. However, the move was far from one-directional. Buyers produced meaningful recoveries on Wednesday and Friday, while sellers controlled the strongest downside move on Thursday.
The weekly range was approximately $150.75. From Monday's opening price to Friday's close, XAUUSD declined roughly 1.8%.
How Gold Traded Each Day
The daily figures show why simply describing the week as bearish would miss much of the story. Instead, buyers and sellers repeatedly shifted control.
| Date | Open | High | Low | Close | Daily Change |
|---|---|---|---|---|---|
| Sept. 7 | $4,427.79 | $4,436.03 | $4,381.08 | $4,405.07 | -0.57% |
| Sept. 8 | $4,406.55 | $4,443.10 | $4,346.07 | $4,355.65 | -1.12% |
| Sept. 9 | $4,360.40 | $4,434.18 | $4,341.44 | $4,401.55 | +1.05% |
| Sept. 10 | $4,404.82 | $4,433.00 | $4,313.71 | $4,315.25 | -1.96% |
| Sept. 11 | $4,315.19 | $4,402.56 | $4,292.35 | $4,348.93 | +0.78% |
1-Hour Chart: The Week's Larger Structure
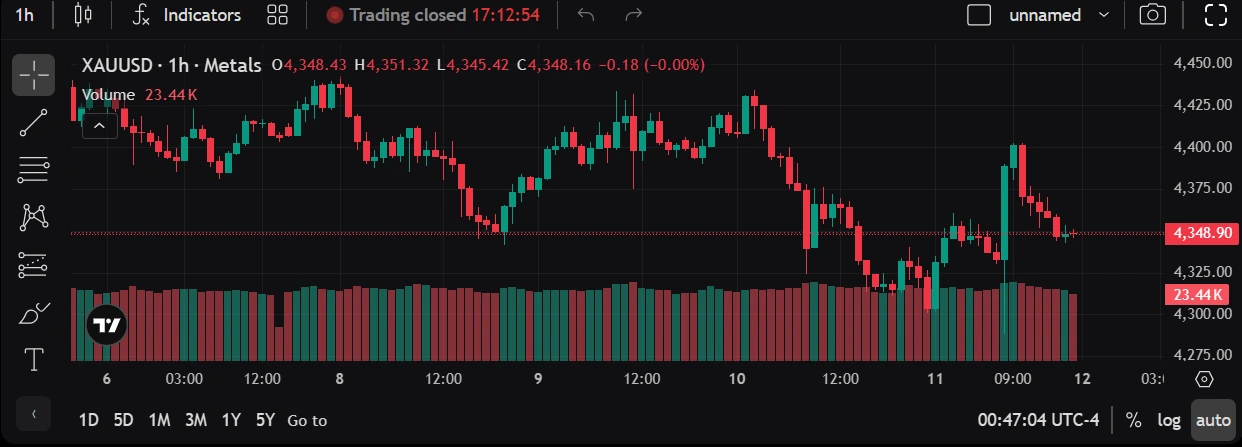
XAUUSD 1-hour chart showing the September 7–11 trading week, including consolidation, increased seller pressure, the weekly decline, and Friday's buyer recovery.
The 1-hour chart shows that gold repeatedly struggled to maintain price above the low-to-mid $4,400 region. Early in the week, buyers attempted to push higher; however, sellers repeatedly responded around the upper part of the weekly range.
Next, selling pressure became more decisive heading into Thursday. Once price lost the previous consolidation area, momentum accelerated to the downside. Nevertheless, Friday's recovery demonstrated that buyers were still willing to respond aggressively near the weekly lows.
Monday and Tuesday: Sellers Begin Applying Pressure
Monday was the U.S. Labor Day holiday. As a result, U.S. market activity was lighter than a normal trading day. Even so, gold remained under pressure after the previous week's strong U.S. employment report increased expectations that the Federal Reserve could raise interest rates.
On Tuesday, sellers became more aggressive. Gold initially traded as high as approximately $4,443 before falling toward the mid-$4,300s. At the same time, oil prices were rising because of escalating Middle East tensions. Higher energy prices increased inflation concerns and, therefore, strengthened the argument for tighter monetary policy.
For gold traders, this created a difficult combination: geopolitical uncertainty could support safe-haven demand, while higher inflation expectations, bond yields, and potential rate increases could pressure the non-yielding metal.
Wednesday: Buyers Push Back
Wednesday provided an important reminder that bearish weeks rarely move in a straight line. Gold recovered more than 1% during the session as the U.S. dollar weakened and buyers returned.
Meanwhile, oil had moved above $100 per barrel, adding another layer of uncertainty. Gold therefore benefited from both a softer dollar and renewed safe-haven interest. However, traders were already looking ahead to Thursday's Producer Price Index and Friday's Consumer Price Index.
Consequently, Wednesday's rebound did not fully settle the week's direction. Instead, it brought price back toward the same upper region where sellers had previously responded.
Thursday: Inflation Data Gives Sellers Control
Thursday produced the strongest bearish session of the week. The U.S. Producer Price Index for August increased 0.4% month-over-month, while final-demand prices were 5.4% higher than a year earlier.
As a result, markets increased expectations that the Federal Reserve could tighten monetary policy. At the same time, Treasury yields rose and the U.S. dollar strengthened. Both developments can create pressure for gold because bullion does not pay interest.
In addition, rising oil prices reinforced inflation concerns. Therefore, sellers had several macroeconomic factors working in their favour at once.
This is an example of why economic-news awareness matters. A chart setup can look attractive before a major release, but high-impact inflation data can quickly change momentum, volatility, and market expectations.
15-Minute Chart: From Seller Control to Buyer Response
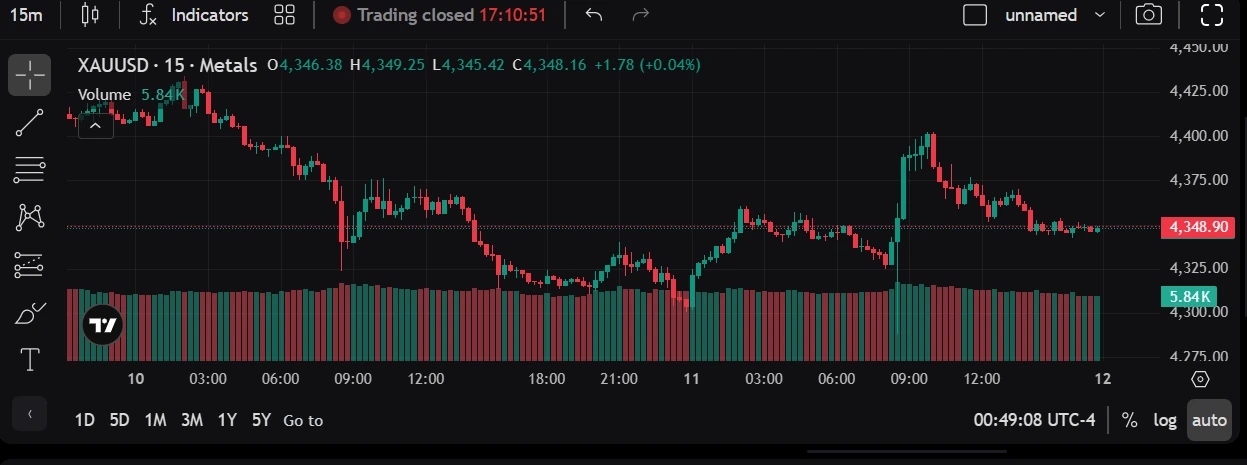
XAUUSD 15-minute chart showing seller pressure on September 10, followed by a sharp buyer reaction and rebound on September 11.
The 15-minute chart makes the shift in control much easier to see. First, sellers steadily pushed price lower during September 10. Once momentum accelerated, price moved rapidly toward the low $4,300 region.
Afterward, price began forming a base. Buyers then responded aggressively during September 11, pushing XAUUSD back toward $4,400. However, that rebound was not fully sustained.
Therefore, Friday should not simply be described as a bullish day. Instead, it showed a strong buyer reaction inside a week where sellers had already caused considerable technical damage.
Friday: Buyers Defend the Lows After CPI
Friday brought another major U.S. inflation release. August CPI rose 0.4% month-over-month and 3.4% from a year earlier. Core consumer inflation, which excludes food and energy, increased 0.3% during the month.
Ordinarily, stronger inflation and expectations for higher rates can pressure gold. However, markets had already experienced a sharp selloff during Thursday's session.
As a result, buyers stepped in near the weekly lows and produced a strong rebound. Gold climbed back above $4,400 during Friday before giving back part of the move and finishing near $4,349.
This was one of the week's most useful lessons: a bearish macro backdrop does not mean price must fall continuously without buyer reactions.
U.S. and London Market Drivers
United States
The strongest scheduled catalysts came from the United States. PPI on Thursday and CPI on Friday both reinforced concerns that inflation remained elevated.
Meanwhile, Treasury yields remained elevated and markets increased expectations for tighter Federal Reserve policy. These developments were particularly important for gold because higher yields raise the opportunity cost of holding a non-yielding asset.
London and European Session
During London and European trading hours, investors were also reacting to rising energy prices, geopolitical risk, and higher global bond yields.
Therefore, London remained an important liquidity period, while the biggest scheduled price risks later in the week came from U.S. economic releases.
How Buyers and Sellers Reacted
Sellers repeatedly appeared around approximately $4,400–$4,445. The strongest confirmation came on Thursday, when price dropped sharply after inflation data strengthened the higher-rate narrative.
Therefore, the upper portion of the week's range remains important because several rallies failed to establish sustained control above it.
Buyers showed their strongest response around approximately $4,290–$4,315. Friday's sharp recovery demonstrated that demand remained present after the week's selloff.
However, buyers were unable to hold the entire rebound into the close. Consequently, the reaction was meaningful without proving that the larger bearish pressure had completely disappeared.
Important XAUUSD Levels From This Week
$4,290–$4,315
This was the week's major lower reaction area. Buyers produced Friday's strongest rebound after price entered this region.
$4,340–$4,360
This area acted repeatedly as a pivot during the week. Price moved through it several times, which makes it useful for observing whether future buyers or sellers gain control.
Around $4,400
The $4,400 region remained psychologically and technically important. Friday's rebound reached above it before losing momentum.
$4,430–$4,445
The upper part of the weekly range repeatedly attracted sellers. A sustained move above this region would represent different behaviour from what traders saw during September 7–11.
These are observation areas from completed price action. They are not automatic buy or sell levels.
What to Watch in Gold Next Week
The Federal Reserve's September policy meeting will be one of the most important scheduled events. Therefore, traders should expect interest-rate expectations, Treasury yields, the U.S. dollar, and Federal Reserve communication to remain important for gold.
Scenario 1: Buyers Reclaim $4,400
If buyers recover $4,400 and can hold above it, attention may return toward the $4,430–$4,445 area that capped several rallies this week.
Scenario 2: Sellers Defend $4,400
If price again fails around $4,400, sellers may attempt to push XAUUSD back toward the mid-$4,300 region.
Scenario 3: Weekly Low Breaks
If the $4,290–$4,315 region fails decisively, that would show that Friday's buyer reaction was not enough to establish lasting support.
Scenario 4: Range Continues
Gold could also remain trapped between the week's major buyer and seller zones while traders wait for greater clarity from the Federal Reserve.
XAU Heatwave does not attempt to predict an exact closing price. Instead, we identify possible scenarios so readers can observe how price responds when important levels and economic events are tested.
The Lesson From September 7–11
The strongest lesson this week was that technical analysis and economic news need to be viewed together.
First, sellers gained momentum as rate expectations, yields, and inflation concerns increased. Next, Thursday's inflation reaction accelerated the decline. However, Friday showed that buyers can still react aggressively after a market becomes heavily sold.
Therefore, traders should avoid assuming that one strong candle guarantees the next move. Instead, wait for structure, confirmation, risk planning, and the candle close.
Trade Heatwave Guides Related to This Week
Want to understand the concepts used in this review? These guides explain them in more detail.
Where the Weekly Information Came From
Trade Heatwave reviews market-price data alongside reliable economic and financial information. This week's research included XAUUSD historical price data, U.S. inflation releases, Federal Reserve information, and TradeLocker charts.
Official economic data:
U.S. Bureau of Labor Statistics
Federal Reserve calendar:
Federal Open Market Committee Meeting Calendar
Price verification:
Daily XAUUSD market figures were reviewed alongside the TradeLocker
charts shown in this report.
Want to Explore Gold Boss Academy?
Trade Heatwave also documents my experience learning through Gold Boss Academy. If you are interested in structured gold-trading education, you can read about my experience first or explore the current GBA access process.
My GBA Experience → Explore GBA Access →Educational Purpose: This XAU Heatwave review is provided for educational and general market-discussion purposes. It is not a trading signal or personal investment recommendation.
Market Data: Prices can vary slightly between brokers, data feeds, and closing times. Trade Heatwave uses available market information and TradeLocker charts to illustrate the week's overall price behaviour.
Forward-Looking Scenarios: The “What to Watch Next Week” section describes possible market scenarios rather than guaranteed outcomes.
Trading Risk: Trading gold, forex, and leveraged financial products involves substantial risk. You can lose some or all of the money you deposit. Always consider your own financial situation and risk tolerance.