
Beginner Gold Trading, XAUUSD & Swing Trading Education
Beginner Gold Trading, XAUUSD & Swing Trading Education
XAUUSD timeframe analysis becomes easier when beginners stop treating every chart as a separate market. Instead, the 4-hour, 1-hour and 15-minute charts can be used together. First, look at the bigger picture. Next, narrow the setup. Then, use the shorter timeframe to study possible entry timing.
A common beginner mistake is opening a 15-minute chart and making a decision based only on what happened during the last few candles. However, a move that appears important on 15M may be relatively small when viewed on the 4-hour chart.
This top-down process gives each chart a different job. Therefore, instead of switching randomly between timeframes, start broad and gradually move toward the entry chart.
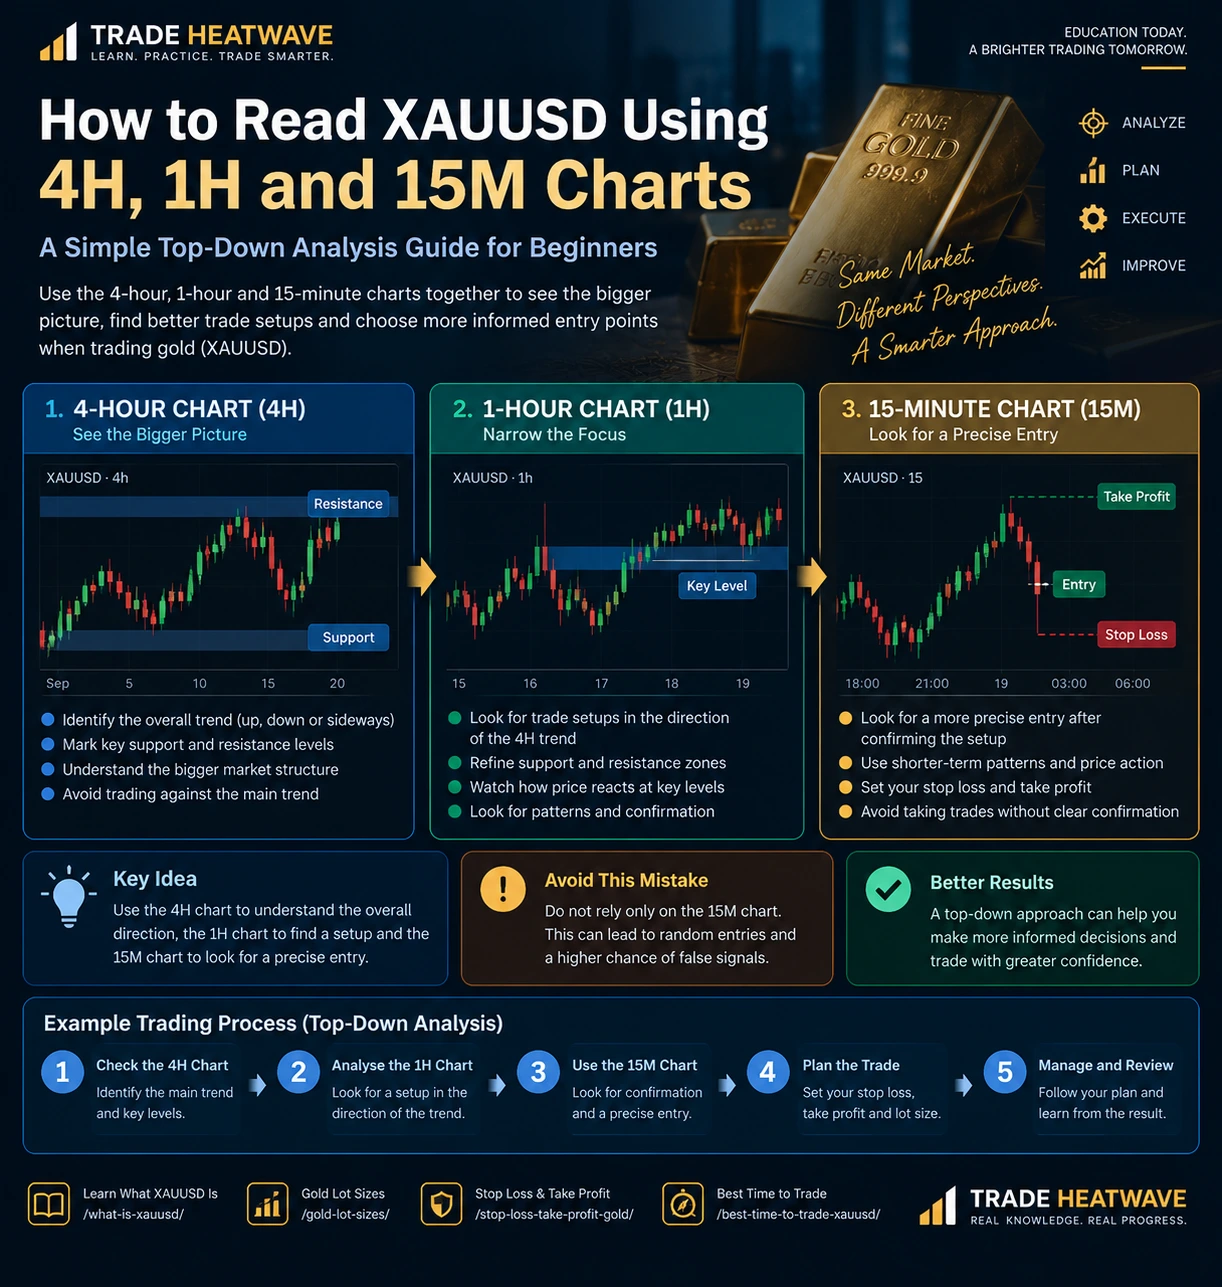
First, open the 4-hour chart before worrying about a precise entry. The purpose of the 4H chart is to understand the broader XAUUSD environment and identify the most obvious market structure.
Ask whether the broader market appears to be moving upward, downward or sideways rather than reacting to one individual candle.
Look for obvious support and resistance zones that have produced meaningful price reactions.
Consider whether price is approaching a major level, breaking away from one or sitting in the middle of a range.
Next, move to the 1-hour chart. At this stage, the goal is not to forget what the 4H chart showed. Instead, use the 1H chart to examine the area more closely while keeping the higher-timeframe direction and levels in mind.
Check whether the possible setup makes sense within the broader direction you identified on the 4-hour chart.
The 1H chart can make it easier to see how price is behaving around a larger support or resistance area.
Do not assume that identifying the trend means you must enter immediately. Price may still need time to reach the area you want.
Then, once the larger setup makes sense, the 15-minute chart can provide a closer view of current price action. This can help a trader look for a more precise entry rather than entering simply because the 4H trend is pointing in one direction.
Observe how price behaves when it reaches the area identified on the higher timeframes.
If price has already moved strongly away from your planned area, waiting may be more disciplined than entering late.
Entry timing is only useful when the stop loss, take profit and position size are also part of the plan.
Identify the broader direction, major structure and important support or resistance.
Refine the important area and study whether a reasonable trade setup is developing.
Study the shorter-term reaction and look for a more precise entry only after the bigger picture makes sense.
First, identify the broader trend and mark the clearest support and resistance areas.
Next, examine how price is behaving around the area identified on the 4H chart.
Then, look for a clearer short-term reaction or confirmation instead of entering blindly.
Define the entry, stop loss, take profit and appropriate position size before clicking buy or sell.
Finally, follow the plan and review what happened after the trade is finished.
Imagine the 4H chart shows an overall upward structure and price is approaching an important support zone. That information alone does not automatically mean “buy.”
This is normal. For example, the broader 4H trend may still be upward while the 15M chart is temporarily moving down. A shorter-timeframe pullback does not necessarily mean that the entire higher-timeframe trend has reversed.
Multiple-timeframe analysis works better when you understand where price is relative to important market structure. Consequently, support and resistance can provide a framework for deciding which areas deserve closer attention on the 1H and 15M charts.
Understand how beginners can identify important XAUUSD price zones.
Most importantly, using several timeframes does not guarantee that a trade will work. Even a setup that appears aligned across the 4H, 1H and 15M charts can fail. Therefore, every trade still needs appropriate position sizing and a defined exit plan.
Learn how changing lot size changes your market exposure.
Define where the trade idea is no longer working as planned.
Start with the basic gold-market terminology if you are new.
The chart may look very different during a quiet period than during an active London or New York session. In addition, major economic news can cause rapid movement across all three timeframes.
Instead of trying this process for the first time with real money, beginners can use demo trading to practice moving through each timeframe in the same order.
Learn what to practice and what to record before considering live trading.
A lower timeframe can create many signals that look important until they are viewed within the broader market structure.
Switching from bullish to bearish after every small candle can make analysis inconsistent.
Checking every available chart can create more confusion. A simple 4H, 1H and 15M routine may be easier for a beginner to repeat.
Ultimately, the purpose of XAUUSD timeframe analysis is not to make trading complicated. Instead, it creates an order for your decisions. First, understand the 4H market structure. Next, refine the setup on 1H. Then, use 15M for closer entry analysis. Finally, plan the risk before entering.
Build your XAUUSD knowledge one practical skill at a time.